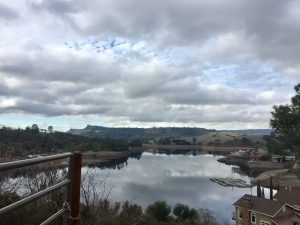
Copperopolis, CA — With the vernal equinox still roughly two months away Tri-Dam officials are signaling signs of the season ahead at Lake Tulloch along with word that the Spring fill schedule is beginning next week.
According to Tri-Dam Project spokesperson and License Compliance Coordinator Susan Larson, the schedule, which was just released by the Bureau of Reclamation, will begin Jan. 31.
As reported here, as the lake reached its lowest levels during its regularly scheduled five-year drawdown, this month was slated for completion of maintenance along with regular inspections. In that same interview with Clarke Broadcasting, Larson also shared that enhanced compliance measures by independent engineers due to last year’s Oroville dam break were also required and also provided an update on a day-use area that may be under development on the Calaveras County side of the Lake Tulloch Bridge by later this year.
The first phase will take place between Feb.1 and March 12, when the reservoir pool will be raised back to the normal winter elevation of 501.6 feet above sea level. She points out that while substantial variations may occur due to natural inflow or storm events, this fill phase is not governed by USACE flood control requirements. So any extra inflow will be retained rather than released.
Beginning March 13 the second phase of the reservoir fill will follow under what she terms as typical spring fill procedures, which follow the USACE flood control curve upward. During this phase the reservoir will be managed to the given target elevation ranges as much as possible, although variations may still occur due to large natural inflows or facility and operational constraints. The general goal is to reach maximum fill levels by or before the Memorial Day weekend holiday — considered the beginning of the summer recreation season on Tulloch — and then to remain that way through Labor Day weekend.
The fill rate will approximately follow the daily ranges listed below:
Phase 1 (elevation targets are approximate)
Date Low High
1/31/2018 475.0 478.0
2/1/2018 475.6 478.6
2/2/2018 476.2 479.2
2/3/2018 476.8 479.8
2/4/2018 477.4 480.4
2/5/2018 478.0 481.0
2/6/2018 478.5 481.5
2/7/2018 479.1 482.1
2/8/2018 479.7 482.7
2/9/2018 480.3 483.3
2/10/2018 480.9 483.9
2/11/2018 481.5 484.5
2/12/2018 482.1 485.1
2/13/2018 482.7 485.7
2/14/2018 483.3 486.3
2/15/2018 483.9 486.9
2/16/2018 484.4 487.4
2/17/2018 485.0 488.0
2/18/2018 485.6 488.6
2/19/2018 486.2 489.2
2/20/2018 486.8 489.8
2/21/2018 487.4 490.4
2/22/2018 488.0 491.0
2/23/2018 488.6 491.6
2/24/2018 489.2 492.2
2/25/2018 489.8 492.8
2/26/2018 490.3 493.3
2/27/2018 490.9 493.9
2/28/2018 491.5 494.5
3/1/2018 492.1 495.1
3/2/2018 492.7 495.7
3/3/2018 493.3 496.3
3/4/2018 493.9 496.9
3/5/2018 494.5 497.5
3/6/2018 495.1 498.1
3/7/2018 495.7 498.7
3/8/2018 496.2 499.2
3/9/2018 496.8 499.8
3/10/2018 497.4 500.4
3/11/2018 498.0 501.0
3/12/2018 498.3 501.3
Phase 2:
From Through Low High
3/13/2018 3/19/2018 498.6 501.6
3/20/2018 3/26/2018 499.4 502.4
3/27/2018 4/02/2018 500.1 503.1
4/03/2018 4/09/2018 500.9 503.9
4/10/2018 4/16/2018 501.7 504.7
4/17/2018 4/23/2018 502.4 505.4
4/24/2018 4/30/2018 503.2 506.2
5/01/2018 5/08/2018 504.0 507.0
5/09/2018 5/15/2018 505.5 508.5
5/16/2018 5/23/2018 506.5 509.5
5/24/2018 9/15/2018 506.5 509.3


